
Agricultural plastic film | Environmentally friendly degradable film | Self adhesive protective film
Conductive film | High barrier cling film | Heat shrink film
Abstract
Transparent components often face critical visibility issues such as reflection and atomization formation. Anti reflection strategies have been developed to improve transparency and reduce reflection. Recently, active anti fog metasurfaces have been introduced to effectively remove fog through photothermal heating using external light, but they are made of optical absorbers that damage visibility. Here, by utilizing the seemingly unfavorable phenomenon of crack formation to address these limitations, a multifunctional optical device combining plasma photothermal heating with anti reflection function is developed. This process produces a linear array of plasma nanoparticles, which generates local heating under illumination, while the mesoporous sol gel mixed silica coating provides anti reflection and water resistance. This device features environmental ellipsometry and hyperspectral microscopy, effectively reducing reflection and accelerating defogging under external light, including smartphone light-emitting diodes (LEDs). Its scalable, solution based manufacturing makes it suitable for applications such as windows, glasses, and low-temperature microscopes. More broadly, this work demonstrates how structural defects can be transformed into functional advantages for optical applications.
introduction
Visibility is a key function of transparent optical materials and plays a crucial role in daily applications. However, maintaining clear visibility under real-world conditions remains a challenge due to phenomena such as reflection at the air/material interface and fog formation caused by water droplet condensation. Surface reflection reduces the amount of transmitted light and is a source of visual discomfort. In many practical situations, atomization can make the surface opaque and obstruct visibility, such as supermarket ventilation, medical and food packaging, electric windshields, and microscope optical components. To address these issues, active research is being conducted to develop functional coatings that enhance optical performance and alleviate these limitations. Anti reflective (AR) coatings are widely used to minimize light reflection and enhance light transmission, not only improving visibility but also enhancing the efficiency of certain devices (solar cells). When light propagates from one medium to another, augmented reality coatings suppress Fresnel reflection losses. The refractive index (nc) of a simple augmented reality coating should ideally be equal to nc=(na * ns) 0.5, where na and ns are the refractive indices of air and substrate, respectively. For example, for glass, an augmented reality coating with a refractive index between 1.2 and 1.3 is required. However, although nanoporous silica can be used to create augmented reality [11], the challenge still lies in the stability of the environment in the atmosphere, especially in the presence of humidity. Even more challenging is that the formation of fog remains an unresolved issue. [14] This phenomenon of obstructing visibility originates from the formation of micrometer sized water droplets, which form on the surface due to the condensation of environmental humidity. These water droplets scatter light, significantly affecting optical clarity. Several anti fog strategies have been proposed. On the one hand, passive anti fog coatings utilize surface wetting properties, namely superhydrophobic or superhydrophilic or absorbent surfaces. Superhydrophobic coatings can delay fog formation and promote defogging. However, they typically rely on micro or nano particle surfaces that are difficult to magnify and often mechanically fragile. The superhydrophilic coating controls the diffusion of water droplets and forms a continuous liquid layer that restricts scattering. However, there are ten unevenness in the water layer, which leads to image distortion and appears in the presence of ice or organic pollutant pollution. Therefore, the durability of these passive coatings remains a technical issue. On the other hand, active anti fog strategies include increasing evaporation rate through surface heating or convection (air flux) or heat conduction (resistivity) to remove fog. However, these solutions require direct contact with the surface and, in some cases, bulky equipment.
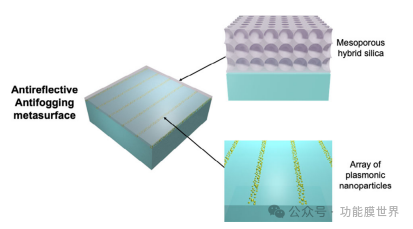
Figure 1. Design and functional schematic diagram of anti reflection and anti fog metasurface.
Recently, the concept of anti fog metasurfaces has been introduced. This method relies on using light to remotely remove droplets through local photothermal heating. Considering this, plasma particles are excellent candidates for manufacturing anti fog metasurfaces because they efficiently absorb light and convert it into heat through the thermal plasma effect. Absorbing particles, such as plasma particles, can blend into different matrices, such as clay MXene、 Double layer or polymer. However, this feature has a major drawback: adding plasma absorbers to the equipment can result in transmission losses. Although the use of light accelerated defogging has been proven, its transparency has decreased by 50% - an unacceptable value for many of the aforementioned applications. The reason is that the entire substrate is covered with absorbent material. J ö nsson et al. reduced the overall coverage by manufacturing nanoantennas made of multiple layers of Au and SiO2 using hole mask colloidal lithography. However, this method lacks control over the density of nanoantennas. In order to better connect the advantages of metasurfaces with other existing anti fog technologies (superhydrophilic, superhydrophobic, or electrically heated films), a summary diagram and an explanatory table are reported. Figure S1 (supporting information) provides detailed results on transparency, response time, energy efficiency, and durability.
Experimental Section
Synthesis of Polystyrene Nanoparticles
The synthesis was carried out in a 2.5L jacketed glass reactor with a mechanical stirrer tightly connected to air and 4 necks. In short, dissolve 40g of Pluronic F127 (Sigma Aldrich) in 1600ml of MiliQ water, then add 240g of styrene monomer (Sigma Aldrich) and 3.46g of NaHCO3 (AlfaCaesar). The monomer is used as received without any additional purification. Stir the solution and rinse with N2 for 1 hour to remove air. Meanwhile, rinse the solution of initiator made from potassium persulfate (3.60g from SigmaAldrich) dissolved in an additional 80ml of water with N2 for 30 minutes. Then add the initiator solution to the monomer solution, stir and rinse with N2 for another 20 minutes. The mechanical mixer is set to 270 revolutions per minute throughout the entire process. The mechanical stirrer is connected in an airtight manner and maintained at a slight N2 flush on the solution surface to provide a slight overpressure, which is released through a needle attached to a neck rubber cap. Then, increase the temperature of the circulating liquid in the jacket to 90 ℃ (reaching 70 ℃ after 35 minutes and 90 ℃ after 55 minutes). Continue the reaction for 5 hours from the liquid reaching 90 ℃. Afterwards, the temperature was set to 40 ℃ and all valves were opened to quench free radicals with oxygen. The emulsion solution obtained by further centrifuging at different speeds and separating from the precipitate. The usage speed is continuous: 1) 4krpm for 10 minutes; 2) 7Krpm for 20 minutes; 3) 8krpm for 15 minutes; 4) 10krpm for 40 minutes. The final solution was dialyzed with MiliQ water exchanged 6 times every 12 hours. Afterwards, obtain a stable colloidal solution of PS latex particles. The solution can be further concentrated to the desired concentration through a rotary evaporator.
Deposition of Colloidal Polystyrene Suspension
Manufacturing periodic cracks through immersion coating: The immersion coating machine (ACEdip, Solgelway) is equipped with a closed chamber where the temperature is regulated by a thermal controller. The substrate (silicon wafer or glass slide) used for thin film deposition is cleaned with acetone and fixed in a preheated chamber at 50 ℃ (unless otherwise specified in the text). Immerse the substrate into the colloidal solution at a constant speed of 2mm − 1s (preheated in the chamber), and remove it from the polystyrene suspension at a speed of 0.002-0.010mm − 1s. The latex concentration is set to 13% by weight.
Preparation of gold wire and gold dehumidification wire
After the preparation of the PS crack layer, a 5nm (in the case of forming a dehumidified gold wire) or 20nm gold layer (for SEM analysis) pattern is metalized on the surface. Then sonicate in acetone for 1 minute to remove PS (used as a mask) and obtain the final gold wire.
For the production of dehumidified gold wire, heat the slide at 450 ° C for 20 minutes to adapt to [54] and obtain a pink slide. Anti reflective coating: Based on previous work, anti reflective (AR) thin films were prepared from a solution composed of TEOS/MTEOS/F127/HCl/H2O/EtOH, with respective molar ratios of 0.5/0.5/0.2/0.005/5/40g (corresponding to a mass of 0.849g/0.727g/0.269g/0.001g/0.734g/15.03g). MTEOS and TEOS are first dissolved in a solution composed of EtOH, HCl (2M), and H2O before adding F127; Stir the solution for at least 2 hours before sedimentation.
Thin films were prepared by immersion coating on gold wires at a rate of 4mm − 1s at room temperature and low relative humidity (RH<10%). Carefully clean the other side of the gold wire with acetone to remove the AR layer. After coating, the mixed film was immediately calcined under a curing infrared lamp at 450 ℃ for 10 minutes. Characterization - Scanning Electron Microscopy and Optical Hyperspectral Microscopy: SEM imaging was performed using SU-70 Hitachi FESEM equipped with a Schottky electron emitter gun, obtained by an internal lens SE detector (column). Cytoviva optical microscope obtains optical and hyperspectral images.
The hyperspectral image of the dehumidified gold wire consists of 50 lines and was acquired with a capture time of 2 seconds in both reflection and dark field modes, with an objective lens of 100. Spectral ellipsometer: The refractive index and thickness of AR thin films were measured from 60 ° to 70 ° using a UV visible variable angle spectral ellipsometer (M2000Woolam), which increased by 5 °. The collection time is set to 2 seconds. The model used to fit these data is the Cauchy model. The ellipsometer is also equipped with an environmental chamber, in which the local environment of the film can be controlled based on relative humidity or vapor pressure.
A mass flow controller is used to manage steam P/P0 by combining two gas flows: i) a dry air flow with solvent P/P0=0, and ii) an air flow with saturated steam P/P0=1 obtained through a bubbler containing water or toluene. The isothermal measurement is set at 70 ° with a collection time of 10 seconds. The transmittance measurement is performed on the same device with an angle set at 0 ° and a collection time of 10 seconds. The micro dot setting provides an anti fog experience.
Place the sample on a temperature controlled platform (LinkamScientifi) and cool it at 0 ° C (slope 20 ° Cmin-1) to condense water on the surface of the sample. Record the reflection intensity every 5 seconds.
Results and Discussion
We first introduced the architecture for manufacturing anti reflective and anti fog metasurfaces. The principle is shown in Figure 1. The optical device consists of i) a line array made of plasmonic nanoparticles on glass and ii) an anti reflective (AR) coating covering the entire surface made of mesoporous hybrid silica. Plasmon lines act as local photothermal heaters: in the presence of dewdrops, applying light will cause a local temperature rise, thereby accelerating surface dehazing. Our initial assumption was that if the width of the plasmonic lines is small enough, surface coverage will be minimized, as the geometry of the thin plasmonic lines maintains the transparency of the device. Mesoporous hybrid silica film serves as an anti reflective coating on glass and also as a protective layer for the underlying plasmonic array. In addition, the composition of the sol gel layer is controlled to obtain a hybrid methylation network to ensure water resistance. The porosity and hydrophilic effect on the surface are important for preventing water from adsorbing into the pores, otherwise it will increase the refractive index and anti reflection performance of the layer.
manufacturing strategy
Considering this, we designed transparent plasmonic lines using the self sorting method of cracks. The typical patterning method is shown in Figure 2a. It includes directional drying of water-based polystyrene (PS) colloidal solution, stabilized by non-ionic block copolymers. Colloidal film is obtained by impregnating the coating, allowing for precise control of the evaporation rate in the capillary evaporation zone. Due to the increase in internal stress, periodic cracks perpendicular to the drying front are formed during solvent evaporation. This process is robust enough to create an ordered array of cracks, perfectly aligned with each other within a few millimeters, as shown in optical microscope image 2b. In addition, the periodicity of linear arrays can be easily adjusted by changing the dip coating speed, providing additional control over device design (which will be discussed later). The typical manufacturing steps for metasurfaces are shown in Figure 2c. Once the colloidal PS layer is applied (step (i)), it will be used as a mask. Sputtering the entire surface of a 5nm thin gold (Au) layer (step (ii)), and then removing the PS layer by washing in acetone, resulting in the fabrication of Au wires (step (iii)). Figures 2d and 2d show scanning electron microscope (SEM) micrographs of the ruptured PS film and corresponding gold wires after chemical removal of PS. In this case, the spacing between these lines is about 20 millimeters. The illustration in Figure 2d shows a top view of a ruptured colloidal film made of 70nPS particles. The continuity of the gold wire is not affected by the irregularity of the crack edge, and its unevenness is also transferred to the gold array (inset in Figure 2e).
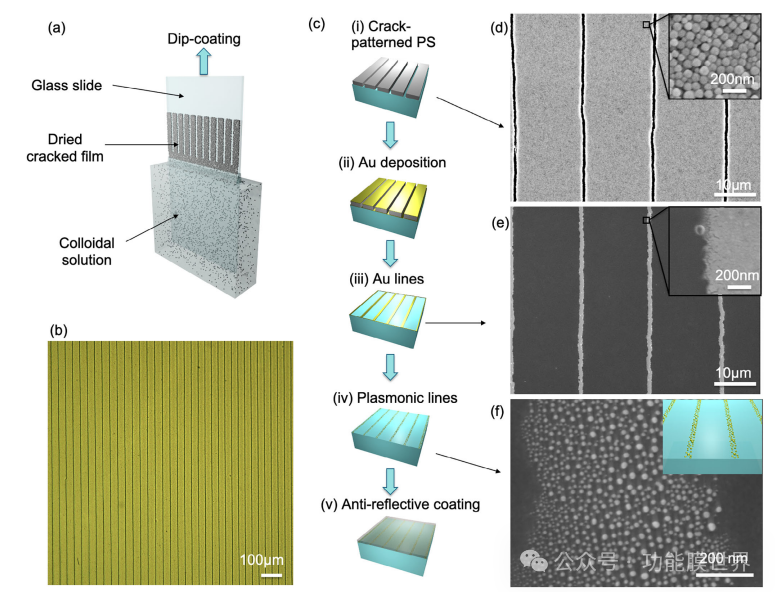
Figure 2a) Schematic diagram of the self ordered process of cracks during PS colloid immersion coating. b) Optical microscope image of PS film with self ordered cracks. c) Preparation steps for anti reflection and anti fog metasurfaces: i) A PS layer with crack patterns generated by immersion coating. Ii) Sputtering a 5nm gold layer on the cracked PS layer. Iii) Use acetone to remove the PS layer in an ultrasonic bath. Iv) Heat the glass substrate at 450 ℃ for 20 minutes to remove moisture from the gold wire. v) Finally, deposit the anti reflective silicon dioxide layer onto the glass slide and then heat treat it at 450 ℃ for 10 minutes. d) SEM micrograph of cracked PS film, illustration showing enlarged view of PS particles; e) Gold wire, illustration shows an enlarged view of such a line; f) High magnification image of plasma Au wire, illustration shows a schematic diagram of the metasurface.
The following steps are to form a wire made of plasmonic particles by thermally induced dehumidification of the gold wire at 450 ℃ for 20 minutes (step (iv)). The reason for applying this strategy is that it is simple. As is well known, heating a thin layer of gold can lead to the formation of plasmonic and discrete gold nanoislands, which can form spherical shapes through solid dehumidification. Figure 2f shows an enlarged view of the plasmon consisting of lines composed of dispersed sub 30 nanometer gold particles. Generally speaking, larger particles tend to exhibit higher absorption. Although previous studies have shown that particle size and shape can affect light absorption and heat generation, this nanoparticle distribution is sufficient to achieve effective anti fogging under external illumination (which will be discussed later). The illustration represents a schematic diagram of this metasurface. The final step involves covering the entire surface with an AR coating made of mesoporous methylated silica (step (v)).
Optical, adsorption, and mechanical properties of the anti reflection layer
To design the device, we first studied the anti reflection layer. This is through sol-gel processing, dipping coating and as detailed in the experiment, heat treatment to produce mesoporous methylated silica coating. By applying the Cauchy model to fit the ellipsoidal polarization curve, the optical properties of the AR layer were measured using spectral ellipsometry (Figure S3, supporting information). Under our experimental conditions, when the thickness is h=148nm, the refractive index of the AR coating is 1.264 (at 700nm). These values of refractive index and thickness represent a good compromise for anti reflective coatings on glass. We simulated the effect of thickness on the transmittance of the system using the optical constants of the AR layer and substrate (Figure S4, supporting information).
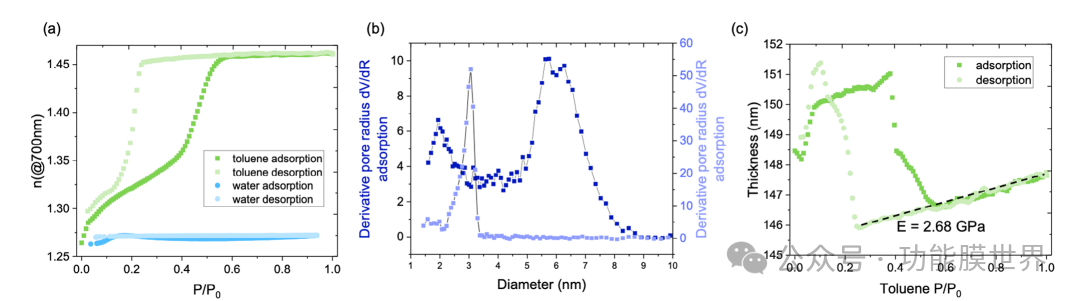
Figure 3. Characterization of Anti reflective Coating by Environmental Elliptical Polarization Porosity Method: a) Evolution of Refractive Index at 700nm in AR Layer as a Function of Water and Toluene Vapor Pressure Increase and Decrease, Indicating Its Hydrophobicity and Stability under High Humidity Conditions. b) The pore size and bottleneck size distribution of mesoporous methylated silica coatings are derived from the adsorption and desorption of toluene vapor. c) In situ monitoring of film thickness shrinkage during toluene condensation and desorption processes, highlighting the mechanical properties of the film.
The simulation results indicate that an AR coating with a thickness of approximately 150nm is a good compromise solution for improving visibility in the visible and near-infrared ranges. To test the water repellency and stability of AR coatings under fluctuating humidity conditions, we conducted the Environmental Elliptical Polarization Porosity (EEP) method in the presence of water. This technology can monitor the changes in refractive index and film thickness during the adsorption and desorption of steam in coating pores, providing insights into their chemical stability, porosity, and even mechanical properties. Figure 3a shows the evolution of the refractive index of the layer as the water vapor pressure increases and decreases. When exposed to humidity, even under high water vapor pressure, the refractive index of silica film remains almost unchanged; From an application perspective, this is very important as it confirms the hydrophobicity and water repellency of methylated silica AR coatings. Due to the hydrophobicity of porosity, we used toluene vapor as an organic probe to study the porosity characteristics. By increasing the P/P0 of toluene, the refractive index increased from 1.264 to 1.461 due to the capillary condensation of toluene in the pores. At high P/P0, the porosity is completely filled with toluene. On the contrary, reducing P/P0 leads to desorption. Starting from the refractive index values at low and high P/P0, we can approximate the porous volume to 37% using the Brueggemann effective medium. The lag between adsorption and desorption curves is due to the difference in pore size and bottleneck size. The bottleneck corresponds to the smaller aperture connecting the larger hole. Based on the Kelvin equation, it is also possible to determine the size distribution of pores and bottlenecks, as shown in Figure 3b. In the case of desorption, the bottleneck size distribution is about 3 nanometers, while the pore size is about 6 nanometers. Finally, the adsorption and desorption of toluene within the pores generate strong capillary forces, leading to film shrinkage and a deeper understanding of the mechanical properties of the film. This thickness shrinkage can be monitored by an in-situ ellipsometer, as shown in Figure 3c.
By analyzing the pseudo linear shrinkage of the film during capillary condensation and desorption processes (as shown in Figure S5, supporting information), we can determine the transverse Young's modulus of the film, which is equal to 2.68 GPa, confirming the robustness of the AR layer. We also evaluated the resistance of AR coatings to UV exposure and mechanical wear. The artificial aging AR layer was exposed to UV light (280-315nm) at an intensity of 225mWCm-2 for 48 hours. Refractive index and water contact angle measurements were taken before and after UV irradiation, and no significant differences were observed (refractive index remained at 1.26, contact angle measurements were 91 ° and 93 °, respectively). These results confirm that the AR layer will not be degraded by ultraviolet radiation and the methyl functional group remains stable. To evaluate the wear resistance, we conducted friction tests using a Crocker gauge. The sample underwent 5000 cycles of dry felt friction under a load of 9N. After testing, visual inspection showed no significant degradation of the AR layer. These findings indicate that even under prolonged exposure to ultraviolet radiation and mechanical wear, the coating exhibits significant optical and protective properties, supporting its ability to be suitable for practical applications.
Optical Design of Devices
The size of the plasma line array needs to be optimized to balance two key contrasting objectives: achieving the re movement of fog through photothermal effect and maintaining overall transparency. Starting from the optical properties of the top AR coating, we conducted simulation studies based on experimental data to design a plasma line array. Initially, we created a layer that completely covered the plasma particles embedded within the AR layer, as shown in Figure 4a. The optical properties of the sample were measured using transmission spectroscopy, and the results are shown in Figure 4c. The experience curve shows a characteristic plasma absorption peak centered at approximately 545nm. At the macroscopic scale, the sample is completely covered by plasma particles, which makes it opaque and gives it a pink color. As shown in Figure 4a, the entire device can be decomposed into two layers: i) top AR layer and ii) bottom anti fog (AF) layer, composed of plasma nanoparticles embedded in mesoporous hybrid silica matrix. The optical refractive index of the plasma anti atomization (AF) composite layer was obtained by fitting the transmittance curve measured in Figure 4c. The analysis adopts a three-layer model. The AR layer (and glass substrate) is described using the Cauchy model, and the optical constants are shown in Figure 4b, determined by ellipsometry as described in Section 2.2. The composite plasma AF layer is considered as an effective medium composed of plasma nanoparticles and hybrid mesoporous silica; Plasma absorption is described using two Lorentz oscillators. Specifically, by fitting the transmittance data, the n() and k() of AF are terminated, as shown in Figure 4b.
The calculated n() and k() components of the AF layer are shown in Figure 4d. The spectrum obtained in Figure 4d shows a main peak with a center of approximately 545nm, corresponding to the localized surface plasmon resonance characteristics of gold particles. Once we obtained the optical constants of different components of the device, as a guiding principle for material design, we simulated the transmittance curve of a sample composed of a plasma line array, which is related to the surface covered by plasma particles. We simulated the transmittance curve of a sample composed of a plasma line array, which is related to the surface covered by plasma particles. As mentioned earlier, dip coating assisted self sorting of cracks allows for adjustment of crack periodicity, which ultimately affects the density and width of plasma lines, thereby affecting surface coverage. According to literature, there is a linear relationship between crack spacing and thickness, which can be easily adjusted with the exit speed of the immersion plating machine.
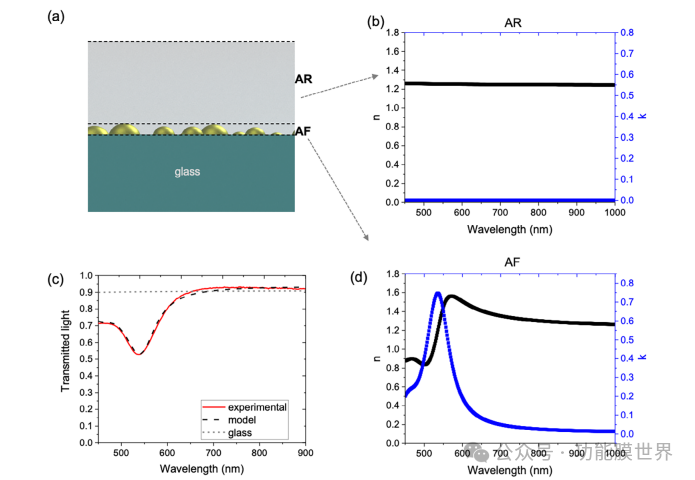
Figure 4a) Schematic diagram of device structure, showing two layers: top anti reflection (AR) layer and bottom anti fog (AF) layer, which are composed of plasmonic nanoparticles embedded in mesoporous hybrid silica matrix. b) The optical constants (refractive index and extinction coefficient) of the AR layer determined by an ellipsometer. c) Experiment and fitting transmission spectra of the device. d) The refractive index and extinction coefficient of the plasmonic AF layer.
Considering this, we use the exit speed of the immersion coating machine as a parameter to easily control the thickness of the film, thereby controlling the crack spacing and crack width. Especially in the capillary state, the thickness is inversely proportional to the exit velocity. In addition, it has been shown that parameters such as humidity or temperature can affect the thickness of the sample. In the capillary state, the film thickness (and subsequent crack spacing) increases with the increase of evaporation rate: therefore, the crack spacing increases with temperature [53] and decreases with the solvent partial pressure in the chamber. Figure 5a shows optical micrographs of three representative samples, which exhibit periodic crack arrays obtained at different exit velocities. Under these conditions, the periodic pattern exhibits different characteristics in terms of crack to crack periodicity (ranging from 47 to 18 μ m) and crack width, as shown in the table in Figure 5a. The reproducibility of batch to batch was validated by repeating each deposition three times (Figure S6a, b, supporting information), and checking the uniformity of deposition by analyzing the top to bottom of the sample, as shown in Figure S6c (supporting information). Due to the sample being several centimeters long, this proves that the formation of large-scale cracks is effective, which is consistent with previous studies. In addition, the SEM image shown in Figure S7 (supporting information) displays the arrangement of cracks within a few micrometers.
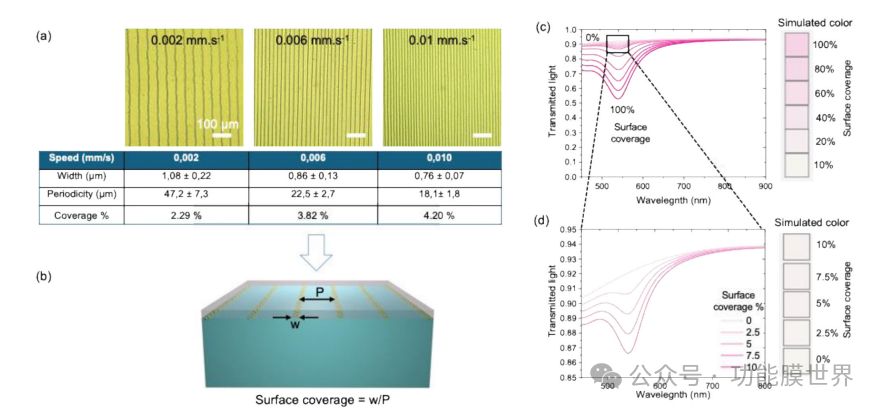
Figure 5. a) Optical micrographs of three representative samples, displaying periodic crack arrays obtained at different exit velocities, showing changes in crack to crack periodicity and crack width, as summarized in the attached table. b) A schematic diagram of surface coverage estimation, calculated as the ratio of crack width (w) to periodicity (P). c) As a simulated transmittance curve and surface color of the plasmon surface coverage function, it shows that 100% surface coverage results in a pink appearance due to strong plasmon absorption at 545 nanometers. d) The simulated transmittance curve and surface color with surface coverage values between 10% and 0% show minimal plasmon absorption and an almost colorless appearance.
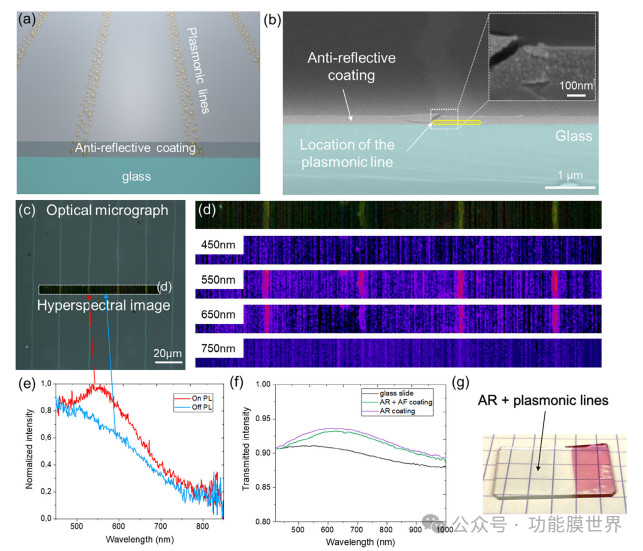
Figure 6. a) Schematic diagram of plasmon lines embedded in anti reflective coatings. b) Cross sectional SEM images of plasmonic lines and anti reflective coatings, with higher magnification images of this portion inserted. c) Optical microscope images of plasmonic lines in reflection and dark field modes, with corresponding d) hyperspectral images and spectral mapping at wavelengths of 450 to 750nm. e) The normalized scattering intensity as a function of plasmonic wavelength in dark field mode (on PL) exhibits a peak of approximately 550nm between lines (outside PL). f) Transmittance intensity as a function of naked glass slide wavelength, AR coated glass, and coated plasma lines supported by glass with AR coating. g) Photos of metasurfaces.
These films are used as masks, as shown in Figure 5b, and the surface coverage obtained from the plasma component can be estimated as the ratio of crack width (w) to crack period (P). Plasma surface coverage is crucial as it strongly affects the transmittance and color of the surface. Using the optical constants determined in Figure 4, we simulated the transmittance curve and surface color as a function of surface coverage, as shown in Figures 5c, d. The simulation was conducted using the CompleteEase software, applying linear interpolation between two models: i) a three-layer model describing the glass+AF+AR layer (as described above) and ii) a two-layer model describing the glass+AR layer. Figure 5c shows that when the surface coverage is 100%, the surface appears pink due to strong plasmon absorption. As a general trend, reducing surface coverage will decrease the contribution of plasmons, resulting in fewer colored surfaces and increased transparency. Figure 5d focuses on surface coverage values between 10% and 0%, which are related to the system derived from crack patterns.
Within this range, the simulated colors indicate that due to minimal plasma absorption, the surface is almost colorless, resulting in high rotation. This analysis can be contextualized by examining the three samples in Figure 5a. From an optical perspective, the samples with the highest periodicity and lowest coverage (2.29%) are expected to produce more transparent devices, but the number of "hot wires" used for defogging is reduced. On the contrary, the sample with the smallest periodicity exhibited a higher density of photo heating lines, but resulted in less transparency of the device (surface coverage=4.2%). In the following section, we will focus on samples obtained at an extraction speed of 0.006mm − 1s, which seems to provide the best compromise between transparency (surface coverage=3.8%) and photo heating capability. As we will discuss later, the line to line periodicity of this sample is approximately 22 μ m, theoretically corresponding to the maximum size of the condensed droplets (responsible for fogging) that will come into contact with the heated plasma line.
Optical characteristics of the device
The optical properties of the metasurface are shown in Figure 6. Figure 6a represents a schematic diagram of the final material, which combines a silicon dioxide AR layer and an anti fog layer made of plasma lines. Figure 6b shows a tilted cross-sectional SEM image. The blue bottom corresponds to the glass slide covered by a layer of silicon dioxide. The plasma lines are highlighted in yellow and appear brighter at the top of the image. The mapping of optical properties of metasurfaces is performed through hyperspectral microscopy in a dark field display. Especially, this technology combines optical microscopy and spectroscopy, where each pixel provides a spectrum. Figure 6c shows the optical microscope image captured in dark field mode, where there are brighter narrow lines due to the scattering of plasma particles. The corresponding hyperspectral image is visible in Figure 6d, with spectral mapping. We represent the scattering intensity in dark field mode at several wavelengths ranging from 450 to 750 nanometers. Due to the presence of plasma particles, these lines exhibit higher scattering at 550 nanometers compared to the rest of the sample. The normalized scattering intensity in DF mode of the line (PnP L) spectrum shows a characteristic plasma peak at 550nm, which is absent compared to the one between the two lines (OffPL) (Figure 6e).
Evaluate the transparency of metasurfaces using spectral ellipsometry in transmission mode. Figure 6f shows the percentage of transmitted light in the visible/near-infrared range through bare glass slides (reference), glass slides with AR coating, and glass slides with Au plasma lines and AR coating. The transparency of the final device coated on glass reaches about 93%, which is particularly high due to two factors: i) the AR coating allows for an expected increase in transmittance of about 3%, [10] ii) the low surface coverage of plasma lines reduces absorption caused by plasma particles. Compared with AR samples, the presence of plasma lines only has a slight effect on the transmittance of the samples. Importantly, from a macro perspective, the surface remains highly transparent within the visible range, as shown in Figure 6g.
Light driven anti fog capability of metasurfaces
Then, we studied the anti fog ability of anti reflective and anti fog metasurfaces. We first explore the local heating caused by the photothermal effect. As is well known, the photothermal efficiency depends on the morphology of AuNPs. Simulation and experimental data have shown that when the particle volume is the same, more complex geometric shapes (such as nano proteins, nano stars, or simple nanorods) have higher heat generation compared to spherical shapes. Furthermore, it has been demonstrated that higher temperature increases are observed based on the concentration of AuNP. When using the simplest system of gold nanospheres, we report in Figure 7a the increase in surface temperature of plasmonic nanoparticles irradiated with 532nm laser as a function of their power. By using light and infrared cameras, a temperature increase of up to 80 ° C can be observed (Figure S8, supporting information). As a comparison, the glass coated only with AR without plasmonic particles did not record temperature changes, confirming the effectiveness of the photo heating method. We verified the ability of surface selective removal of dew through optical microscopy.
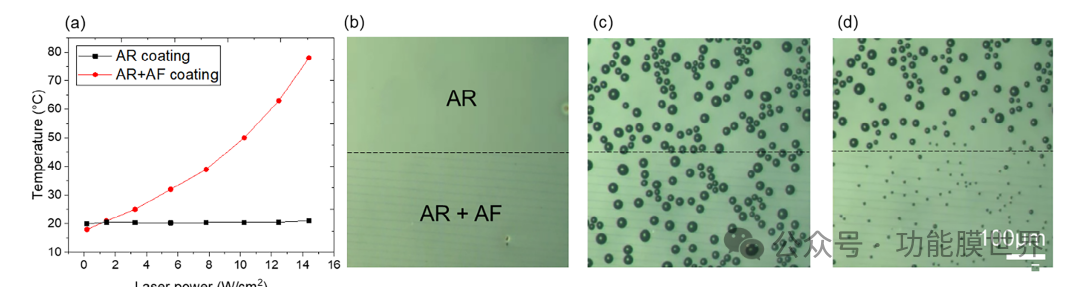
Figure 7. a) Temperature as a function of laser power (532nm) was measured using an infrared camera for two samples with and without plasma lines. A series of optical microscopy images of the sample substrate, b) horizontal boundary between the plasma line (AR+AF) and the area with only AR coating (T=18 ° C, RH=58%). As time passed, the substrate cooled from 30 ℃ to 0 ℃ (with a slope of 20 ° Cmin-1), c) the appearance of water droplets, and d) disappeared in the area with plasma lines when the laser was turned on.
Figure 7b shows a micrograph of the surface, which is divided into two halves: the bottom has plasma lines (AR+AF), and the top only has an AR coating without plasma lines. As shown in Figure 7c, dewdrops are formed by condensation of water on all surfaces. This is achieved by reducing the surface temperature to 0 ℃ during the Peltier stage with a relative humidity of approximately 58%. Then apply light onto the surface using a 532nm laser. After 15 seconds of exposure, the dewdrops at the bottom containing plasma lines were almost completely removed (Figure 7d). Figure S9a (Supporting Information) displays two graphs showing the difference in droplet size before and after laser irradiation. For the AR region, the diameter of the water droplet remains constant, while for the plasma line, it decreases from 27 μ m to 7 μ m. After laser exposure, the droplet size regenerated, but it was still significantly smaller than the droplet on AR alone. This simple experiment (as well as the experiment with vertical boundaries between plasma lines (Figure S10, supporting information) confirmed that local light heating is caused by the presence of plasma lines.
To quantify this behavior, we explored the photo induced dehazing dynamics of metasurfaces. Place the sample on a cooling plate to induce water condensation and dew formation. Figure 8a shows a typical experiment (with the experimental setup described in Figure S11 and supporting information). Normalized reflection intensity will be measured using ellipsoidal polarization micro dots and used as a measurement standard for defogging. Therefore, we explored the variation of this reflection intensity as a function of time and in the presence of light. At the beginning, the surface temperature is 19 ° C and the relative humidity is 64% (step A). No dew formation, high reflection intensity. Then we cooled the sample (from 19 to 5 ℃, with a slope of 20 ℃ min − 1). Cooling leads to the formation of dew, which results in a decrease in reflection intensity due to scattering. After 1 minute at 5 ℃ (step B), the cooling plate is turned off and the light is turned on (first using a 532nm laser). Under these conditions, water droplets evaporate, resulting in an increase in reflection intensity. Then analyze the recovery time (trec), which is the time required to recover to the initial strength. More precisely, we define 'acquired time' as follows (1):
To quantify this behavior, we explored the photo induced dehazing dynamics of metasurfaces. Place the sample on a cooling plate to induce water condensation and dew formation. Figure 8a shows a typical experiment (with the experimental setup described in Figure S11, supporting information), where normalized reflection intensity measured using elliptical lines is used as an indicator for defogging. We explored the variation of reflection intensity as a function of time and the presence of light. At the beginning, the surface temperature is 19 ° C and the relative humidity is 64% (step A). No dew formation, high reflection intensity. In step B, we then cool the sample (from 19 to 5 ℃, with a ramp of 20 ℃ min − 1). Cooling leads to the formation of dew, which results in a decrease in reflection intensity due to scattering, as can be seen between points A and B in Figure 8a. After 1 minute at 5 ℃, turn off the cooling plate (step C) and turn on the light (first using a 532nm laser) to measure the time for droplet evaporation. Under these conditions, the evaporation of water droplets causes an increase in reflection intensity (step D). In Figure S12 (Supporting Information), we plotted the absolute drying time of droplet evaporation under non illumination and illumination conditions at different light intensities. To better compare the results, we introduced the recovery time parameter (trec), which is the time required to return to the initial intensity, and then analyzed it. More precisely, we define 'acquired time' as follows (1):

This corresponds to the difference in recovery time between dark and light configurations, divided by the recovery time in the dark.
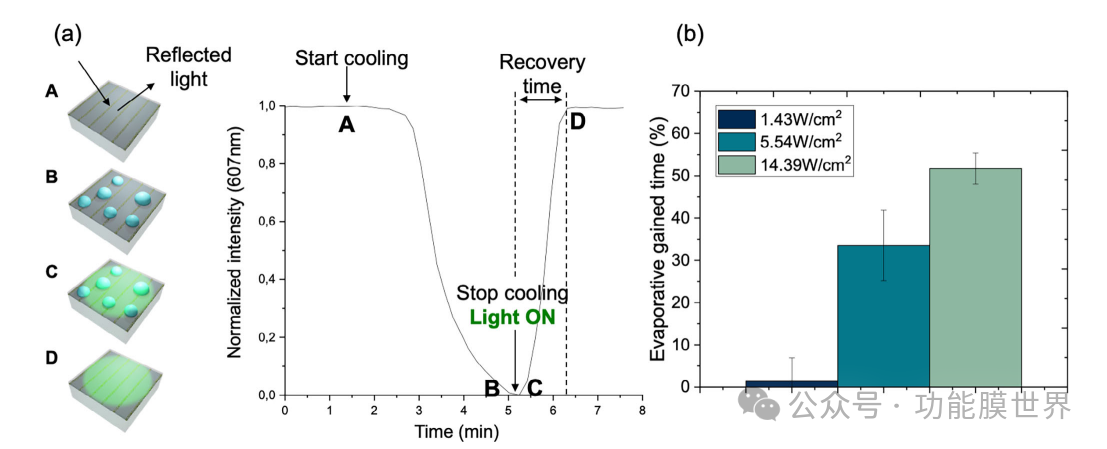
Figure 8. a) Schematic diagram of the experimental principle. The normalized intensity of the reflected light from the plasmonic lines restored by the AR coating was measured as a function of time (T=19 ° C, RH=64%) using an elliptical polarization micro point setup. Step A: Cool the board from 19 ° C to 5 ° C (with a slope of 20 ° Cmin − 1). Droplets are forming, causing a decrease in reflection intensity (step B). Step C: Stop cooling and turn on the laser. Step D: Evaporate all droplets and restore their initial reflection intensity. b) Plot the evaporation gain time based on the laser power.
Figure 8b illustrates the percentage increase in evaporation time obtained at different laser power levels. Due to higher local temperatures, increasing laser power will result in greater time gain. Under the optimal conditions (14.39 Wcm − 2), achieve an evaporation time of over 50%. It is worth noting that this defogging method is not limited to monochromatic lasers, but in principle can be compatible with other artificial wide range light sources that are more suitable for applications. To demonstrate for the first time the applicability of this metasurface to other light sources, we conducted an additional experiment by illuminating the sample with a white LED light from a smartphone, as shown in Figure 9a.
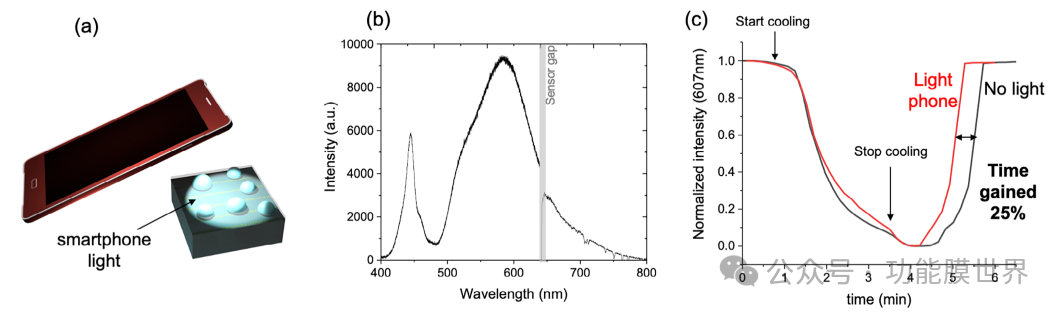
Figure 9. a) Illustration of defogging experiment driven by white light from smartphone LED; b) Spectrum of smartphone LED; c) Defogging experiment: Normalized intensity of reflected light coating as a function of time, with and without smartphone light irradiation on the surface.
The spectrum of the light source shown in Figure 9b shows that the smartphone LED provides a wide range of light between 500 and 700 nanometers, which is compatible with the excitation of plasma lines. Similar to previous experiments, the normalized reflectance intensity of the system was measured as a function of time (Figure 9c). Due to the formation of fog on the surface of the equipment, the intensity decreases due to light scattering. Then the cooling was stopped, and we analyzed the time difference for complete evaporation of the droplets. Figure S13 (supporting information) shows the absolute evaporation time of no light and mobile phone light. As a result, the evaporation time gain increased by about 25%. The first result is encouraging as it indicates that this defogging method can be further optimized to use low-power light sources. Given that self sorting of cracks is a low-cost and scalable method, this anti fog and anti reflection system has the potential for real-world applications using artificial light for atomization. Although our research has demonstrated the effectiveness of anti reflective and anti fog metasurfaces under controlled conditions, further research is needed to evaluate their performance in real-world environments. Controlled tests, such as those conducted in this study, are crucial for validating and comparing defogging strategies as they provide reproducible conditions and quantitative insights. However, future work should explore the behavior of devices under different humidity levels, temperature fluctuations, and various lighting sources (including natural sunlight and artificial indoor lighting). In addition, long-term stability studies are crucial for evaluating the durability of metasurfaces in long-term use. These studies will help improve design and optimize equipment for specific applications, including car windshields, supermarket refrigerator doors, and optical instruments operating under humid conditions.
Finally, the balance between transparency and photothermal efficiency is a key factor in the practical application of our metasurfaces. Our results indicate that although higher power densities were used in controlled experiments to systematically study heating behavior, the device is capable of generating heat at lower light intensities, such as LED lighting. This highlights the role of spectral absorption width in photothermal performance. Monochromatic laser sources require higher power to induce heating, while a wider absorption spectrum will achieve more efficient energy conversion under artificial illumination. This consideration can be extended to solar radiation, which provides higher intensity than smartphone LEDs. In order to further improve efficiency under real-world conditions, future optimizations may include designing absorption spectra to enhance heat generation while maintaining transparency. A promising approach is to integrate anisotropic plasmonic nanoparticles that exhibit tunable resonances extending into the near-infrared range. This modification can more effectively utilize the environment and artificial light sources, including light-emitting diodes, without affecting optical visibility.
Conclusion
In conclusion, we introduce a multifunctional sol gel anti reflective and anti fogging super surface with high transparency and effective light driven defogging capability. By utilizing crack formation as an advantage, we have developed a device that integrates a plasma photothermal array and an anti reflective coating into a single solution treatment apparatus. Under the guidance of simulation, we optimized the plasma nanoparticle array and methylated silicon mesoporous coating to improve transparency, provide waterproofing, and prevent fluctuating conditions. It is worth noting that the metasurface provides 93% cross parent capability, while achieving a 50% increase in defogging ability under our exposure conditions. Importantly, we provided a concept validation through the use of LED lights on smartphones, demonstrating for the first time that this metasurface utilizes artificial low-power light to effectively accelerate defogging. These characteristics make metasurfaces particularly suitable for practical use in environments prone to fogging, such as car windows, food packaging, glasses, sports goggles, and low-temperature microscopes. Further development of metasurfaces may include the use of anisotropic plasma particles, combined with other types of plasma nanoparticles or light absorbers, to optimize more effective photothermal heating in the near-infrared (NIR) range. This enhancement can expand the device's operational capabilities under various lighting conditions, improving its versatility and transparency in the visible light range. From a broader perspective, this work demonstrates how defects such as cracks can be utilized for advanced optical applications.


